
TeamDesk holds the data in flat tables meaning that it consist from fixed number of columns and variable number of rows. While such structure can contain a lot of information it can be difficult to present summarized info in such a way.
Let’s demonstrate typical Task Management application. We have a project to work on, a person to perform the task, a date the task is performed and a amount of time spent on the task:
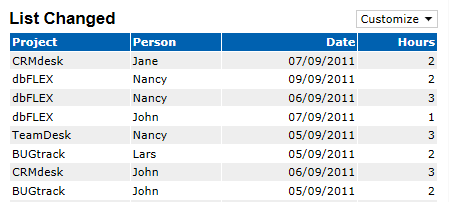
Now we need to find an answer: how much time the team spent each day on each project. Obviously you can obtain the results using summary views:

Obviously, the answer is found, but you’d likely want to have subtotals for all projects each day as well as subtotal by the project for the whole time period.
With charts you would be closer to the goal – you’ll have approximate subtotals by day, but you won’t get precise value. For example, for 06/09/2001 is a total 18 or 19?

Also, charts are limited to calculate single value. So, cross tabs will bridge the gap between summary and chart views.
For a cross tab you’ll need to specify the field whose values will form columns in an output and another field whose values will form rows; and then the field(s) and function to calculate to form a value of a cell on an intersection of row and column. In our example projects will form columns while dates will form rows; each cell displays the number of tasks and total time spent.

Rows, columns and cells are clickable. Clicking on a column heading will display records by specific project for all dates. Clicking the date will display records by specific date for all project. And clicking the cell will display records by specific date and project:

We hope cross tab views will add the value to TeamDesk toolset.


This is very, very helpful for us!