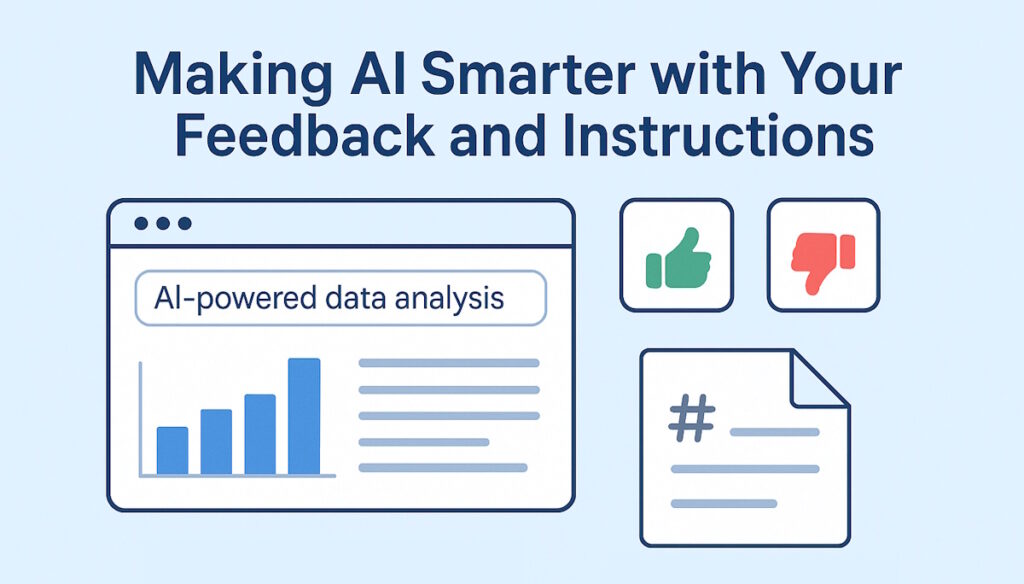
When we introduced AI-powered data analysis for TeamDesk, our goal was simple:
let you ask questions about your data in plain language and get meaningful, visual answers — without building views, formulas, or charts manually.
Since then, many of you have started using AI to explore real business data: financials, inventory, operations, analytics, and more. And with real-world usage came two clear requests:
- “How can I tell the AI Data Analysis whether its answer was actually helpful?”
- “How can I teach the AI Data Analysis how our data works?”
Today, we’re happy to introduce two major enhancements that address exactly that.
Feedback That Helps AI Data Analysis Learn
AI data analysis works best when it continuously improves based on real usage.
That’s why we’ve added response feedback directly to AI-generated answers.
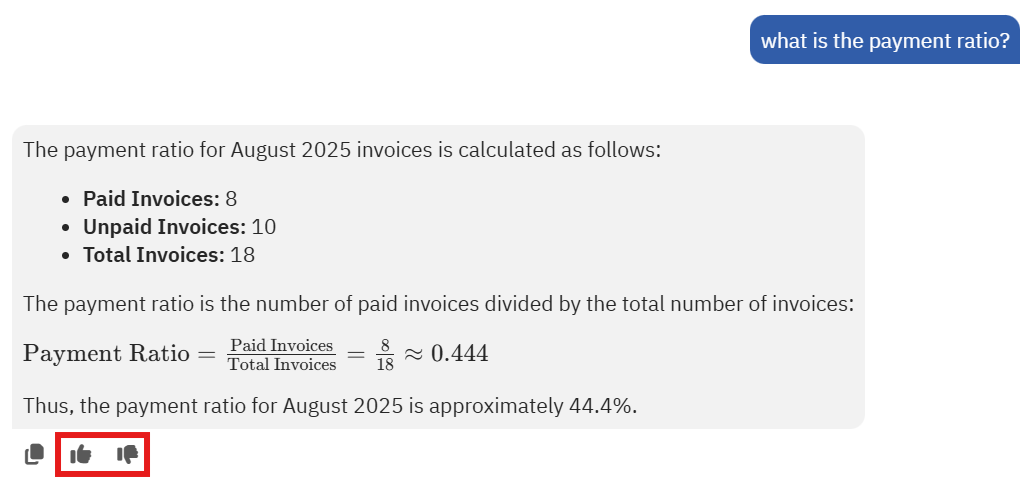
After each AI data analysis response, you can now mark it as:
- 👍 Good response
- 👎 Bad response
This feedback is not just cosmetic.
We will use it to:
- Identify successful response patterns
- Detect unclear, incorrect, or misleading answers
- Fine-tune our AI models to better match how TeamDesk users expect data to be analyzed and presented
In short: the more you use it, the smarter it gets.
Teaching AI Data Analysis How Your Tables Really Work
Every database is different.
Column names, business rules, preferred calculations, reporting formats — these are things only you fully understand.
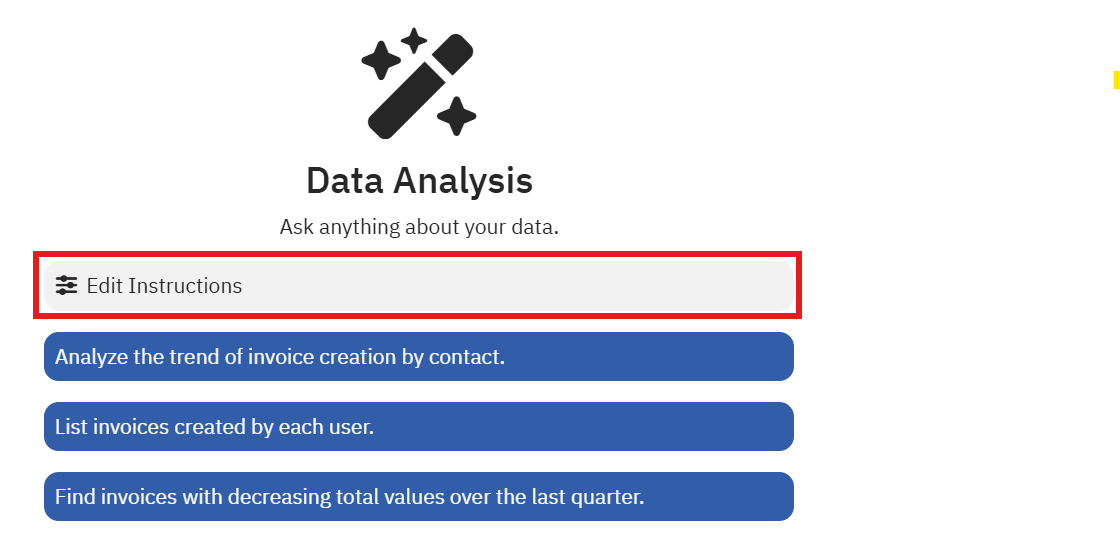
To solve this, we’ve added the ability to provide table-specific AI instructions for data analysis.
How It Works
For each table in your database, you can now add additional instructions that guide the AI when analyzing that table.
These instructions are stored as a Markdown file in the Database Resources section and automatically applied whenever AI analyzes data from that table.
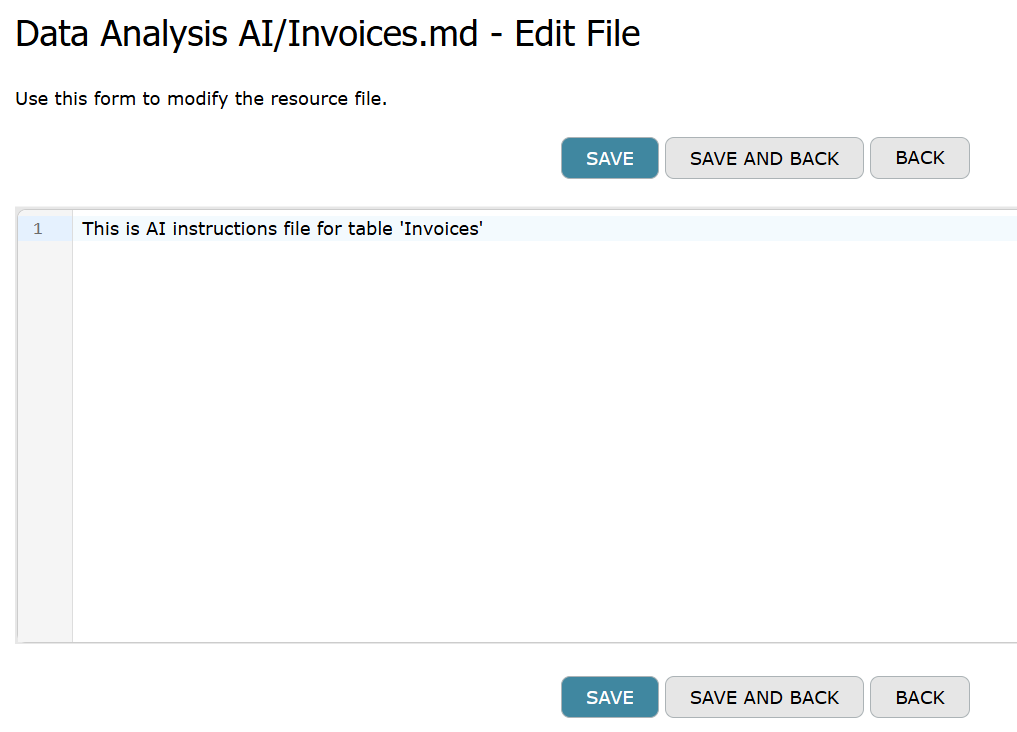
Think of it as documentation written for the AI, by you.
What You Can Instruct the AI To Do
With table-level instructions, you can tell AI things like:
- Which columns are:
- primary identifiers
- monetary values
- dates used for reporting
- Which filters are:
- required
- optional
- commonly used (e.g. “exclude canceled records”)
- How data should be represented:
- totals vs averages
- grouped by month, category, customer, etc.
- preferred chart types
- Special business rules:
- sign conventions (debit/credit, positive/negative amounts)
- calculated balances
- domain-specific terminology
Example instructions might include:
- “Use
EntryDatefor all time-based filtering.” - “Amounts in this table are stored as signed values.”
- “When summarizing revenue, group by
CustomerandMonth.”
The AI will follow these rules consistently — without you having to repeat them in every question.
Why This Matters
These two features — feedback and custom instructions — work together.
- Feedback tells us what worked and what didn’t
- Instructions tell the AI how your data should be handled
- The result is AI that feels:
- more predictable
- more accurate
- more aligned with your business logic
Instead of reinventing logic every time, the AI builds on:
- your feedback
- your rules
- your preferred reporting style
What’s Next
We’ll continue improving AI data analysis based on:
- your feedback
- real usage patterns
- evolving reporting needs
If you haven’t tried it yet, now is the perfect time:
- ask questions
- review responses
- provide feedback
- teach AI how your data works
Your data.
Your rules.
Smarter answers — every time.