Updated May, 10th, 2022, added a paragraph on profiling non-UI operations.
Sometimes you may wonder, what’s going on in your database? Why the dashboard is loading slow? Why it takes ages to save the record? Here is our new performance profiler to help!
To start performance profiler, open dropdown menu with your name in top bar. Here, you’ll see Profiler: Off menu item. Click it to start the profiling. The page will reload and yellow bar will indicate the profiling is on.

Now perform actions you want to profile. Switch tabs, edit records, save, whatever. When done, use either user menu or a link in a yellow bar to stop profiling and examine the results.
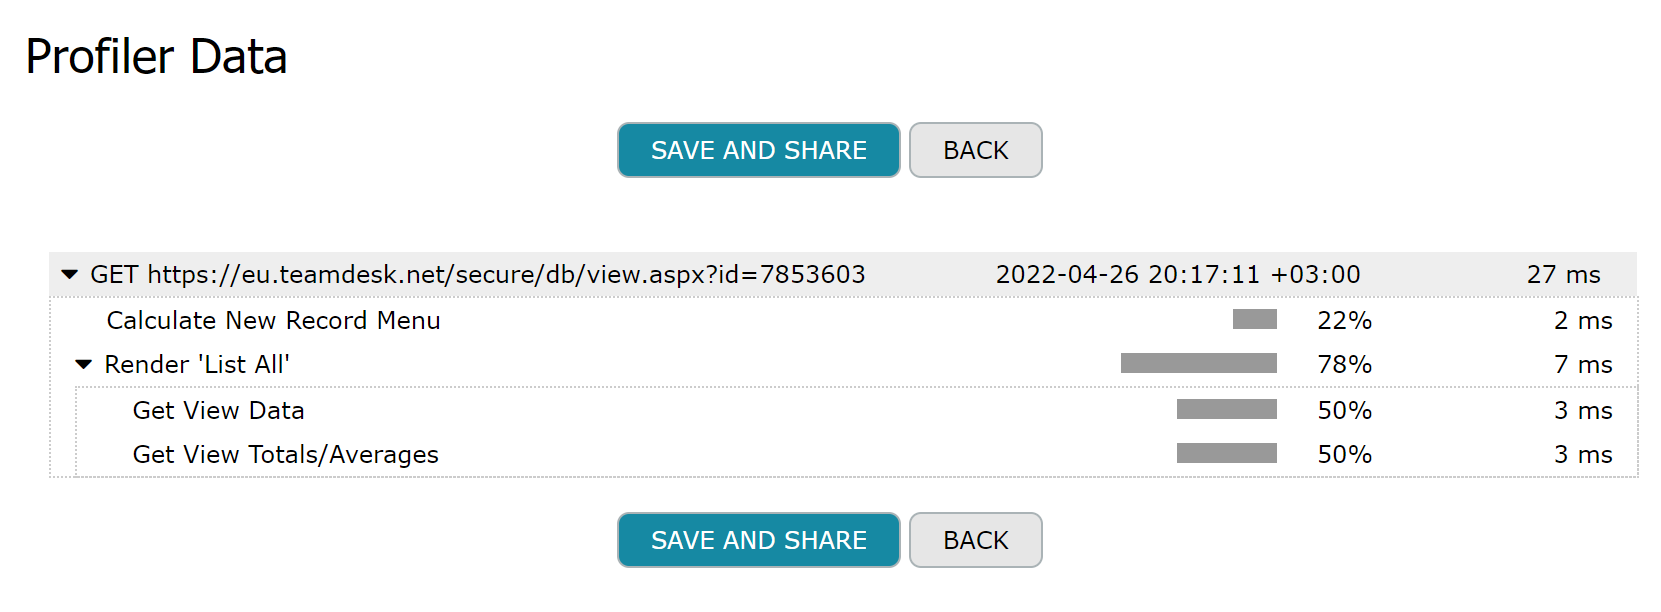
Let’s start with something simple. Navigate to some view, turn on the profiler and once page refreshes turn it off. You’ll see the results:

And you can save the results to share with TeamDesk support team or other admins of your database.
How to interpret this? We spent 27ms to render the page. This time is counted from first byte we got till the last byte we sent.
There are two sub-entries: Calculate New Record Menu and Render ‘List All’. We do not track every sub-operation but data access as we crunch numbers really fast, but data access is the typical bottleneck. So, from 27ms for the whole page we spend 2ms to calculating actual state of New Record menu displayed under tabs and 7ms to render List All view.
Going deeper, to render the view we needed two requests for data: one to get the records to display, that’s Get View Data and another one, to get number of records and group/grand totals and averages, if any. That’s Get View Totals/Averages. We spent 3ms on each request.
Simple enough? Let’s try preview form with details:

Here it takes two web requests to display the page. First is to render master record with one data access request. Second is to display detail view for the master record, it’s the same as displaying just the view, we discussed above.
Edit form? Easy!

Here we see we needed one data request to get the record to edit and another one to populate the dropdown.
But where profiler really shines is to track what’s happening on save and custom buttons.
As a sample database we took Copy Record with Details and Sub-Details which has fairly complex copy logic. And now you have a chance to look on how internals works.

The button executes three actions – one to copy master record, one to copy the details and one to copy sub-details. Latter two actions use RecordSet columns to get the list of records to copy and repeat the action on each source record. It is all visible in profiler. There are two detail records to copy (we expanded one to see sub-operations, another one is collapsed). And there are four sub-detail records to copy.
Triggers and associated actions, web requests made by Call URL actions will all be visible in profiler results.
For non-UI parts such as periodic and time-dependent triggers, view subscriptions, webhooks, and REST API calls we collect profiler data automatically. Link to the profiler data is added to corresponding log entries.
The profiler simply collects the performance samples from the code we execute and does not alter your data or the way we process it in any way.
Happy profiling!


Nice work. Thanks guys.
This is really great – thanks a lot for this great tool to improve the performance of our tables.
The sharelink is very convenient – with a copy button 🙂
I look forward to make comparisons between update actions and Rest API calls
I can see the time-cost of the formula calculations.
Can you confirm this includes:
-1- Formula field calculations
-2- Retrieval of children records data
-3- Non formula field default value updates
Do you calculate -1- and -2- every at each rendering ?
Could you give us some rule of thumb idea on how the calculation of the various types of field compare (ex Number / Text / Multi-line Text / Date / Location / ) ?
Kind regards,
Pierre
I can definitely use this to check the performance of my site. Various times my users question me about the performance of certain activities.
I would like to know is there any way we can do this profiling when we do REST API calls to the system. 99% of my data updates are done by API calls which in turn perform several trigger actions.
Yes, formula values are calculated on each rendering, but it’s not that straightforward. We are not querying the database every time we need the some column’s value. Rather we collect the information of what we need to display the data – for the view it’s a set of columns and formulas to display, filtering conditions, row colorization formulas, custom buttons and document filters and so on. Then we build (sometimes gigantic) query to the database, a sort of “SELECT column1, column2, column1 + column2 * column3 FROM table WHERE filter”. Query processing is all upon backend database and we can not measure the costs of individual column’s retrieval (though our DBA can do it to some extent). To measure what slows the query down you can profile basic view, remove column(s) in suspect, profile again and compare the results.
Due to information is likely volatile we do not store interim results. It’s always a tradeoff between efforts we spend to calculate and efforts we would need to spend to keep stored calculated value up to date. Consider master record and a some detail records; and a formula in detail record that uses the lookup to master. Updating master record’s value would lead to recalculation in details. While the number of detail records is low updating would probably make sense, but once you have a million of detail records it would be a pain.
REST API and Webhooks profiling is coming up next.
I think I had once a remark from Slava telling me that
I could not make a formula nesting more than 10 formulas (or calculated using another formula-record, which would be in turn calculated using another formula record, … 10 times) – or something like that.
I expect the number of nested calculations is a factor of slowness.
Would it make sense / Could it be possible to display the complexity level of all the formula fields in a database ?
Kind regards,
Pierre